Every production incident I’ve investigated traces back to one root cause: the engineer who built the system had a different mental model of it than the system itself.
Not a bug. Not a bad language choice. A wrong mental model.
Systems thinking gives you tools to build the right model before you ship, and to recover faster when reality corrects you anyway.
This isn’t a philosophy post. It’s a field guide for backend engineers who want to reason about distributed systems the same way control engineers reason about physical ones: with precision, with feedback, and with a clear-eyed view of where things break.
The Bathtub Model: Stocks, Flows, and Why Your System Overflows
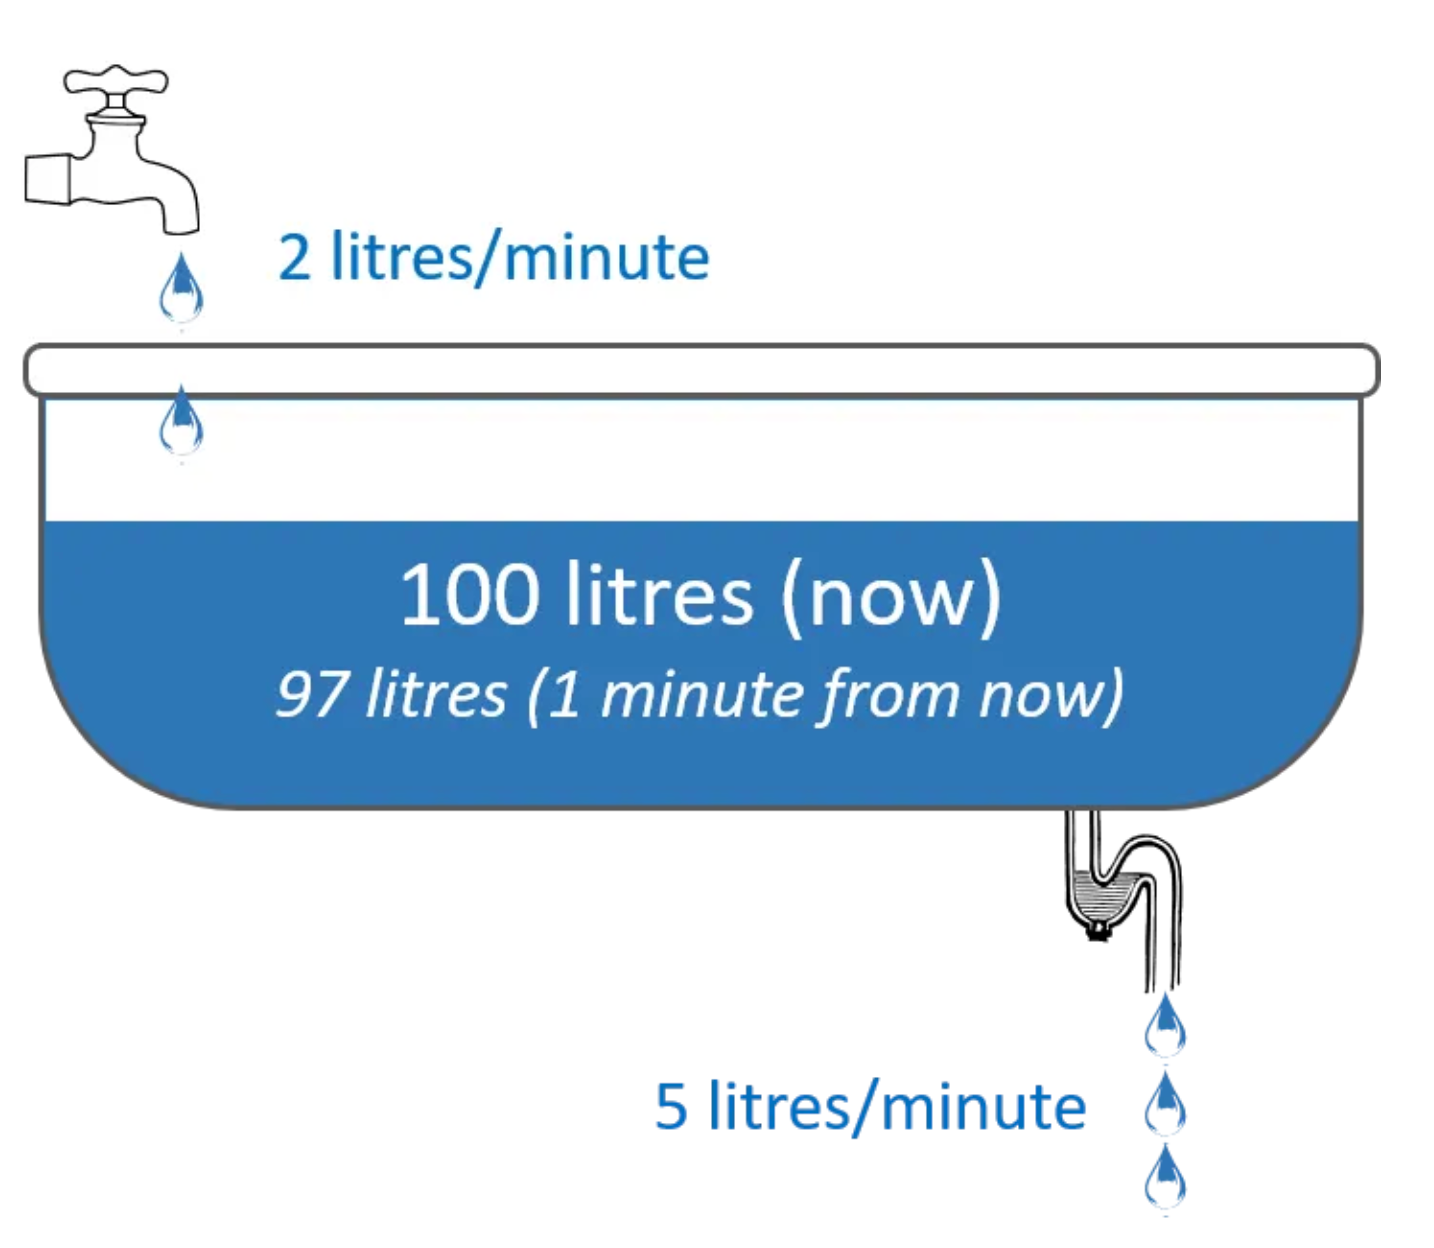
Every system you operate can be modeled as a bathtub. The stock is the current state: queued requests, active connections, heap memory, records in a database. The inflow is the rate at which state accumulates: requests per second, events published, bytes written. The outflow is the rate at which state drains: responses sent, events consumed, records deleted.
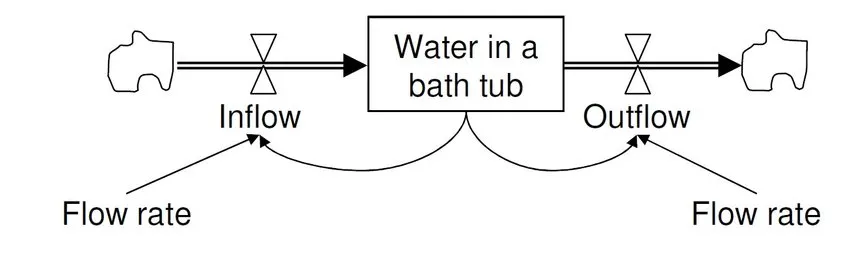
Your system is healthy when outflow ≥ inflow. Your system is sick, often silently, when inflow exceeds outflow and the stock accumulates unbounded.
This is not a metaphor. This is a deterministic model. Queue depth grows when producers outpace consumers. Connection pools exhaust when new connections arrive faster than in-flight requests complete. Memory grows when allocations outpace GC reclamation. All of these have one diagnosis: an unchecked inflow with no backpressure.
The Failure Scenario
Startup A’s codebase was clean. Handlers were well-structured, test coverage was solid. But every request was processed inline:
// No backpressure. No admission control. Just accept and process.
func handleRequest(w http.ResponseWriter, r *http.Request) {
    result := processRequest(r) // could take 200ms or 20s
    w.Write(result)
}
Under 10× normal load, this handler spawns 10× the goroutines. Each goroutine holds a DB connection. Connection pool exhausts. New goroutines block. The stock of in-flight requests grows until memory pressure causes the process to OOM-kill, or until database timeouts cascade outward.
The code was correct. The system model was wrong.
The Fix: Explicit Flow Control
Startup B made the stock visible and added admission control:
The key insight: the queue depth is now observable, bounded, and actionable. When it fills, you return 429 instead of silently building up latency debt.
When to Bend This Rule
Latency-sensitive, stateless workloads (e.g. health checks, static asset serving) may not need admission control. But anything that touches a shared resource (database, cache, or downstream API) needs explicit flow control. The rule bends; the physics doesn’t.
Feedback Loops: The Invisible Governor of System Behavior
A feedback loop is the mechanism by which a system responds to its own state. Get this wrong and your system either oscillates into instability or collapses slowly enough that nobody notices until it’s too late.
There are two types:
- Balancing feedback stabilizes the system. Autoscaler adds replicas when CPU exceeds threshold; removes them when it drops. Thermostat.
- Reinforcing feedback amplifies change. A slow service causes callers to retry; retries increase load; load increases latency; latency triggers more retries. Thermal runaway.
The Failure Scenario: Monitoring Divorced from Reality
A team I worked with had excellent dashboards: p99 latency, error rate, and queue depth. The dashboards updated every 60 seconds. Their on-call rotation checked the dashboards at the start of each shift.
Reinforcing feedback killed them quietly. One upstream dependency started returning errors for ~2% of requests. Retry logic kicked in. Each retry held a connection for slightly longer. Over 45 minutes, connection pool utilization crept from 40% to 98%. At the start of the next shift, queue depth was a flat line: the queue had stopped accepting new work. The system had already failed. The dashboard told them so 45 minutes late.
The Fix: Build Feedback Into the System, Not the Dashboard
func autoScaler(metrics MetricsClient, infra InfraClient) {
    ticker := time.NewTicker(15 * time.Second) // tighter loop than 60s
    for range ticker.C {
        load, err := metrics.GetLoad()
        if err != nil {
            // Failing to measure is itself a signal
            infra.Alert("metrics_unavailable")
            continue
        }

        switch {
        case load > 0.80:
            infra.AddReplicas(5)
        case load > 0.95:
            // Emergency: shed before scaling can catch up
            infra.EnableLoadShedding()
        case load < 0.30:
            infra.RemoveReplicas(2)
        }
    }
}
More importantly: instrument the feedback loop itself. Emit metrics when the autoscaler fires. Alert when load shedding activates. The action the system takes in response to its own state is one of the most diagnostic signals you have.
How This Applies to Distributed Systems
The bathtub model and feedback loops are not backend abstractions; they are the exact dynamics that make distributed systems hard.
Retries and Backoff
Retries are a reinforcing feedback loop. Every retry on a degraded service increases its load. Exponential backoff with jitter converts a reinforcing loop into a balancing one:
func retryWithBackoff(ctx context.Context, fn func() error) error {
    base := 100 * time.Millisecond
    max := 30 * time.Second

    for attempt := 0; attempt < 8; attempt++ {
        if err := fn(); err == nil {
            return nil
        }

        backoff := min(base*time.Duration(1<<attempt), max)
        // Add jitter to prevent thundering herd (synchronized retry storms)
        jitter := time.Duration(rand.Int63n(int64(backoff / 2)))

        select {
        case <-ctx.Done():
            return ctx.Err()
        case <-time.After(backoff + jitter):
        }
    }
    return fmt.Errorf("max retries exceeded")
}
Without jitter, all callers back off and retry simultaneously. This is the thundering herd, a reinforcing feedback loop disguised as safety logic.
Idempotency
Retries only work safely if your operations are idempotent. This is a stocks-and-flows issue: if a payment processes twice because the network dropped the acknowledgment, you’ve created a stock imbalance (money moved) that doesn’t match the intended flow (one transaction).
pub async fn process_payment(
    db: &Pool,
    idempotency_key: &str,
    payment: Payment,
) -> Result<Receipt, PaymentError> {
    // Check if this key has already processed
    if let Some(receipt) = db.find_by_idempotency_key(idempotency_key).await? {
        return Ok(receipt); // Return cached result, do not reprocess
    }

    let receipt = charge(payment).await?;
    db.store_with_key(idempotency_key, &receipt).await?;
    Ok(receipt)
}
The idempotency key is a stock. You’re ensuring that multiple flows (retry attempts) produce the same stock change (one charge). This is systems thinking applied to correctness.
Observability as Feedback Infrastructure
Observability is not dashboards. Observability is the feedback loop between your system’s internal state and your ability to reason about it. The three pillars (logs, metrics, and traces) correspond directly to stocks and flows:
- Metrics tell you the current state of your stocks (queue depth, memory, error rate)
- Traces tell you the shape of flows (request latency across service boundaries)
- Logs tell you what changed and when (events that modified stock state)
If your observability doesn’t answer “what is the current depth of every queue in the critical path?” you are flying blind in a storm.
Resource Limits and Concurrency Control
Every shared resource (goroutine pool, DB connection pool, file descriptors) is a stock with a hard ceiling. Exceeding it causes cascading failure, not graceful degradation.
// Semaphore pattern: explicit concurrency ceiling
type WorkerPool struct {
    sem chan struct{}
}

func NewWorkerPool(maxConcurrent int) *WorkerPool {
    return &WorkerPool{sem: make(chan struct{}, maxConcurrent)}
}

func (p *WorkerPool) Submit(ctx context.Context, fn func()) error {
    select {
    case p.sem <- struct{}{}:
        go func() {
            defer func() { <-p.sem }()
            fn()
        }()
        return nil
    case <-ctx.Done():
        return ctx.Err()
    default:
        return ErrPoolExhausted // visible, actionable signal
    }
}
Making ErrPoolExhausted observable: increment a counter, log the event, and convert an invisible resource ceiling into a feedback loop you can act on.
Monolith vs. Event-Driven: The Delay Effect
Systems thinking has a precise term for what happens when feedback is delayed: oscillation. You correct too little because you haven’t seen the effect yet, then overcorrect, and the system swings past equilibrium in the other direction.
Monolithic architectures process requests synchronously. Every step in the request path adds latency to every other step. One slow dependency blocks the entire call chain.
Under load, a 2-second DB spike converts a 110ms P99 into a 2-second wall across all active requests simultaneously.
Event-driven architecture introduces explicit delays, but those delays are managed rather than accidental:
The tradeoff is real: you now have eventual consistency, operational complexity, and distributed transaction semantics to reason about. Event-driven isn’t free; it trades synchronous complexity for asynchronous complexity. Choose based on which failure mode is more acceptable: latency coupling or consistency windows.
The Language Question (Finally Answered Correctly)
Rust vs. Go is not an architecture debate. It’s a type system tradeoff.
Go gives you fast iteration, readable concurrency primitives, and a runtime that handles most memory management automatically. You pay with a GC that can introduce latency spikes under allocation pressure, and a type system that won’t catch use-after-free or data races at compile time (though the race detector helps at test time).
Rust gives you compile-time memory safety, zero-cost abstractions, and predictable latency without GC pauses. You pay with a steeper learning curve, longer compile times, and more friction in rapid prototyping.
The decision is a tradeoff between stock of developer velocity and stock of runtime reliability. Use the right tool for the subsystem dynamics:
// Rust: payment processing. Memory corruption here = real money lost.
// The borrow checker is a balancing feedback loop on your own code.
pub fn process_payment(payment: Payment) -> Result<Receipt, PaymentError> {
    let charge = gateway.charge(&payment.amount, &payment.method)?;
    // Rust's ownership model prevents use-after-free of charge
    Ok(Receipt::from(charge))
}
// Go: admin dashboard API. Speed of iteration matters more than GC jitter.
func renderDashboard(w http.ResponseWriter, r *http.Request) {
user := auth.UserFromContext(r.Context())
metrics, _ := metricsClient.FetchLast24h(r.Context(), user.OrgID)
json.NewEncoder(w).Encode(metrics)
}The polyglot approach is not cargo-culting. It’s matching the system dynamics of each subsystem to the tooling that produces the best failure properties for that specific context.
Leverage Points: Where Small Changes Have Large Effects
Most engineering effort goes to the least effective interventions: tuning constants, adding more instances, rewriting existing code. These are low-leverage changes.
High-leverage interventions change the system’s feedback structure:
| Intervention | Leverage Level | Example |
|---|---|---|
| Tuning a timeout value | Low | Changing DB timeout from 5s to 3s |
| Adding more replicas | Low-Medium | Horizontal scaling under sustained load |
| Changing information flow | High | Adding distributed tracing across services |
| Changing system structure | Very High | Adding a circuit breaker |
| Changing the goal | Highest | Switching from “serve all requests” to “protect downstream” |
The circuit breaker is the canonical high-leverage pattern. It changes the system’s goal from “process everything” to “protect the system from its own overload”:
Without this pattern, a failing downstream service causes callers to block until timeout, consuming connections and goroutines. With it, failures after threshold trip the breaker and callers fail immediately, preserving resources for healthy paths.
Production Failure Case: The Invisible Queue Buildup
Here’s a realistic production failure I’ve seen variants of multiple times.
Setup A service accepts webhook events from a payment provider and writes them to a Postgres table for downstream processing. The webhook handler is synchronous: it inserts the record and returns 200 before the downstream processor picks it up.
The violation No queue depth monitoring. No backpressure between the webhook handler and the DB write. No circuit breaker between the DB write and Postgres.
The failure sequence
- A deployment introduces a slow query in an unrelated part of the application. Postgres query planner picks a bad index. P99 DB latency increases from 8ms to 400ms.
- Webhook handlers start taking 400ms instead of 8ms. Inbound webhook connections from the payment provider start queuing at the load balancer.
- The payment provider’s retry logic kicks in: events that didn’t get a 200 within 200ms are retried. This doubles the inflow rate.
- The load balancer queue fills. The payment provider sees connection timeouts and escalates retry frequency.
- Postgres is now receiving 8× normal write load, all of it retries of events that already wrote successfully (no idempotency key on insert). Duplicate records accumulate.
- DB CPU hits 100%. All writes start failing. Webhook handlers return 500. Payment provider stops retrying, starts queuing on their side.
- On-call engineer wakes up to a flood of 500s and a Postgres CPU alert. No distributed tracing. No queue depth metrics. The duplicate records aren’t obvious because the table doesn’t have a unique constraint on the idempotency key.
Debugging difficulty High. The bad query and the webhook failure appear unrelated in the logs. The duplicate records aren’t surfaced by standard monitoring. Tracing the retry amplification requires reconstructing the timeline from payment provider logs, load balancer access logs, and DB slow query logs separately.
What would have prevented this
- Idempotency key with a unique constraint on insert (prevents duplicates)
- Queue depth metric on the webhook handler’s inbound buffer (surfaces backpressure before it cascades)
- Circuit breaker on the DB write (fast-fails webhook handlers instead of holding connections)
- Distributed tracing (correlates the slow query with the cascade)
Each of these is a feedback loop. None of them are in the original system. That’s why it was hard to debug.
Design for Evolvability, Not Perfection
The greatest lie in software architecture is the upfront perfect design. Complex systems are not designed; they evolve from simpler systems that worked. John Gall’s law is not a philosophy; it’s an empirical observation from decades of systems failures.
The practical implication: optimize your system for the ability to be wrong safely
- Make failure modes explicit and bounded (circuit breakers, bulkheads, timeouts)
- Make system state observable (metrics, traces, structured logs)
- Build for partial degradation rather than binary up/down (graceful degradation, feature flags, shadow mode)
- Prefer reversible architectural decisions over irreversible ones (event logs over destructive mutations, blue-green deploys over in-place upgrades)
The engineer who identifies as a “Go programmer” or a “Kafka shop” has outsourced their systems thinking to their tools. The engineer who identifies as someone who builds systems that survive contact with reality, and chooses tools accordingly, is the one you want on call at 3am.
Summary: The Mental Model Checklist
Before shipping any significant backend system, answer these:
- What are my stocks? Queue depth, connection count, memory, in-flight requests.
- What are my inflows and outflows? At what rate does each stock fill and drain?
- What happens when inflow > outflow? Where does the overflow go? Is it bounded?
- What feedback loops exist? Are they balancing or reinforcing? How fast do they operate?
- Where are my leverage points? What structural changes have outsized effect on resilience?
- What are the delays? Where does latency in one component block another? Is that coupling intentional?
- What does failure look like? Can I observe it before customers do? Can I recover without a deploy?
If you can answer all seven before you ship, you are not guaranteed to avoid production incidents. But you are guaranteed to recover from them faster and understand why they happened.
That’s the only technical advantage that compounds over time.